Hello, I am Marcel, I am 36 years old – it is never too late to start something, is it? – and today I want to add a chapter to my diary from the motorsport world. Enjoy reading this part of the Diary of a Motorsport Engineer
This one is thought to be „quick and dirty“ with not much time to rest before next weeks shakedown and then NLS doubleheader.
Today I like to go back to the time when my journey all started: 24h Nürburgring 2022. My task was simple and challenging at the same time: „Tell me when which driver has to be in the car during the 24h race”. On Wednesday before the race I received a coloured Excel spreadsheet with „it could look like this“. Within two days of writing some Excel magic I had this:
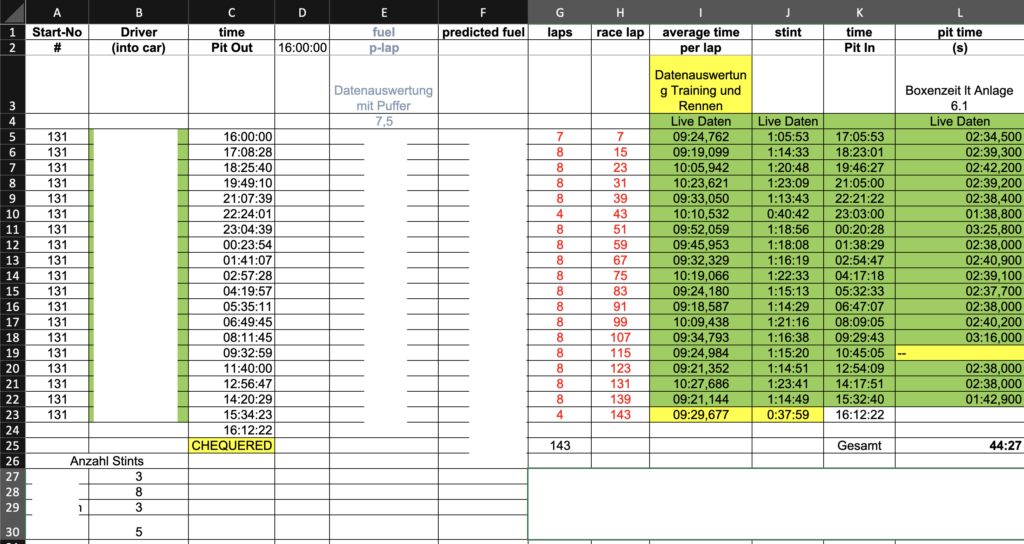
During the race I just needed to fill the laptimes, the fuel used and had automatic adjustments of “wake up times” for the drivers. Besides this, my responsibility was, to make sure the driver exits pit lane with the least amount of time lost. Three seconds per pit stop lost against the minimum stop time means a minute time loss for the entire race.
So now it is not 2022 anymore, but 2024. Everything gets more complicated. More cars, more drivers, more responsibility and more data.
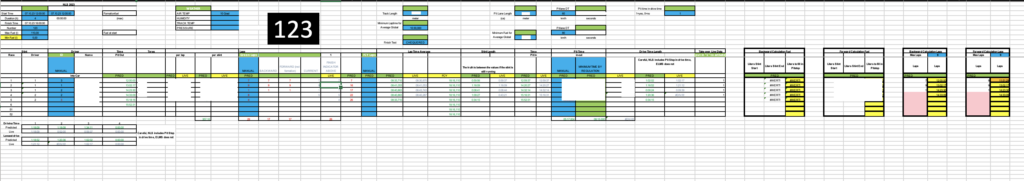
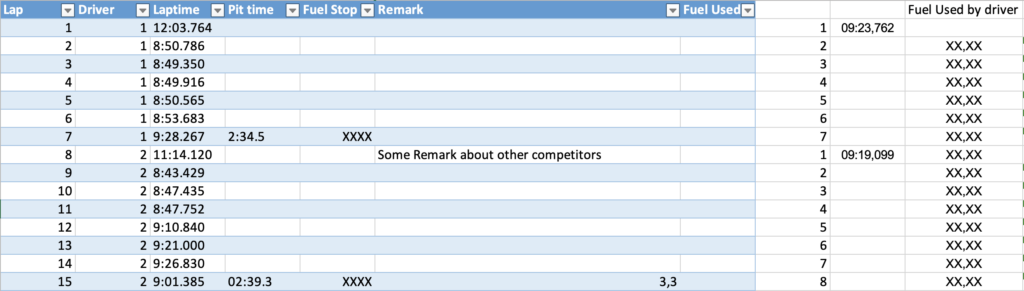
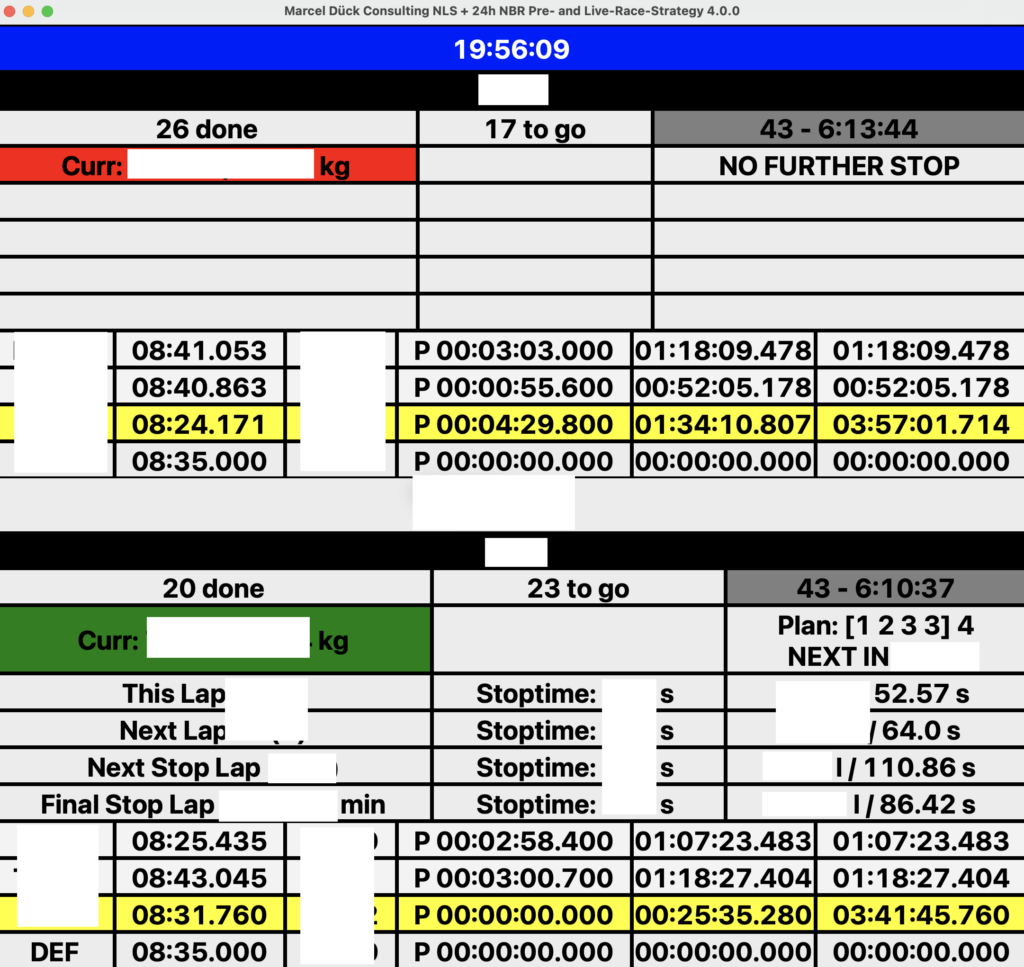
These days my spreadsheet has some some “multiple line per cell calculations” to be able to track a full race of a single car. Drivers, driving times, laps, laptimes, gaps, fuel, tires, average laptimes and average fuel consumption per driver and stint, forward and backward simulations (which are sometimes quite empty – BUG!).

The picture above shows the live calculation of the number of laps in one stint. I still adjust it manually for the future planning. Just while writing this down I have an idea for a new feature. „Laptime drop“ between the first and the last lap. I have a visualisation of this already, but more on this later …
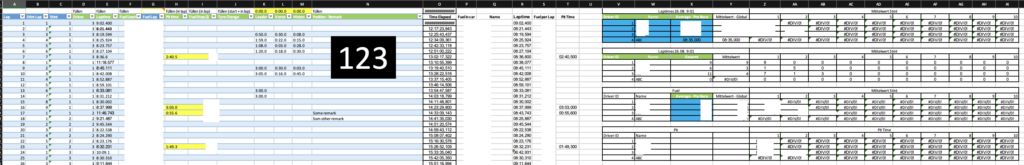
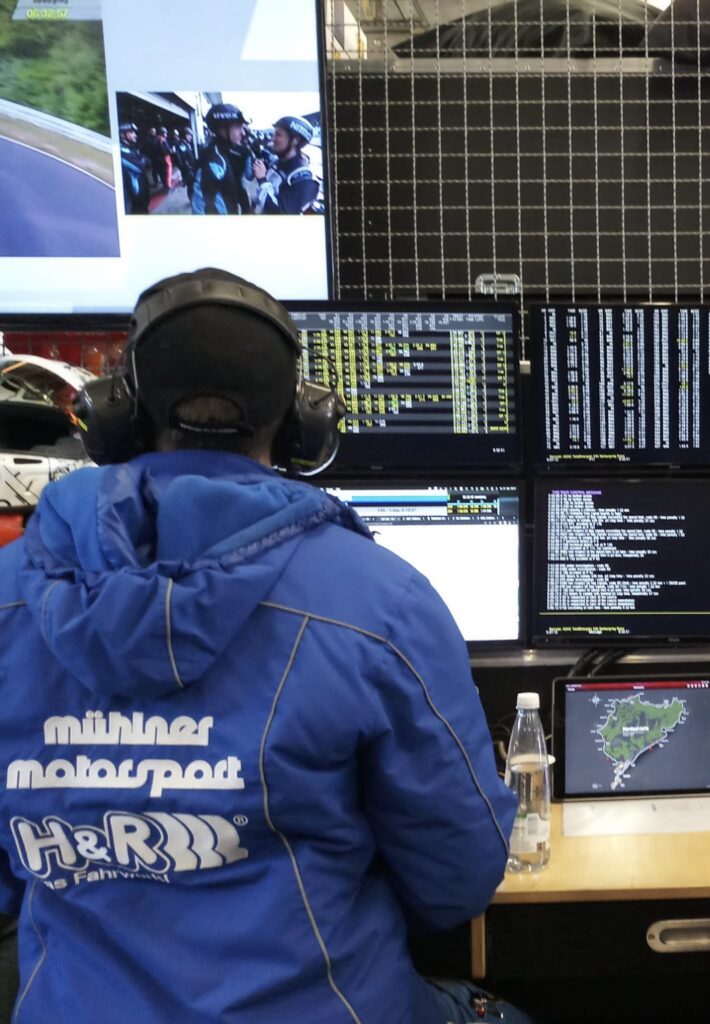
The information is spread over two sheets and different cells which is sometimes a bit tricky in a stressful situation. On the occasion of a change of the plan it is also necessary to change specific cells, like the lap number for the stint. This is still a bit uncomfortable. As my experience grows, I have confidence that my head does not rely on the correct cells when the moment comes to take a decision.
I am a pretty good with software. I started coding when I was 15 at school and did a lot of development in my time at the university and my jobs. So I wrote a tool to visualize and calculate some more information based on my Excel sheet. Python is a nice and easy language. Once setup, it is easy to run. Many frameworks are available to work with and there is a huge community. So I picked python to code and run my software during the race.
Last year I managed two cars. Run plan, race strategy, pit stop planning, so I adjusted my tool to have two cars on three different views. Fuel Consumption and laptime development in a chart and in another view a gapper tool based on my inputs in the sheet.
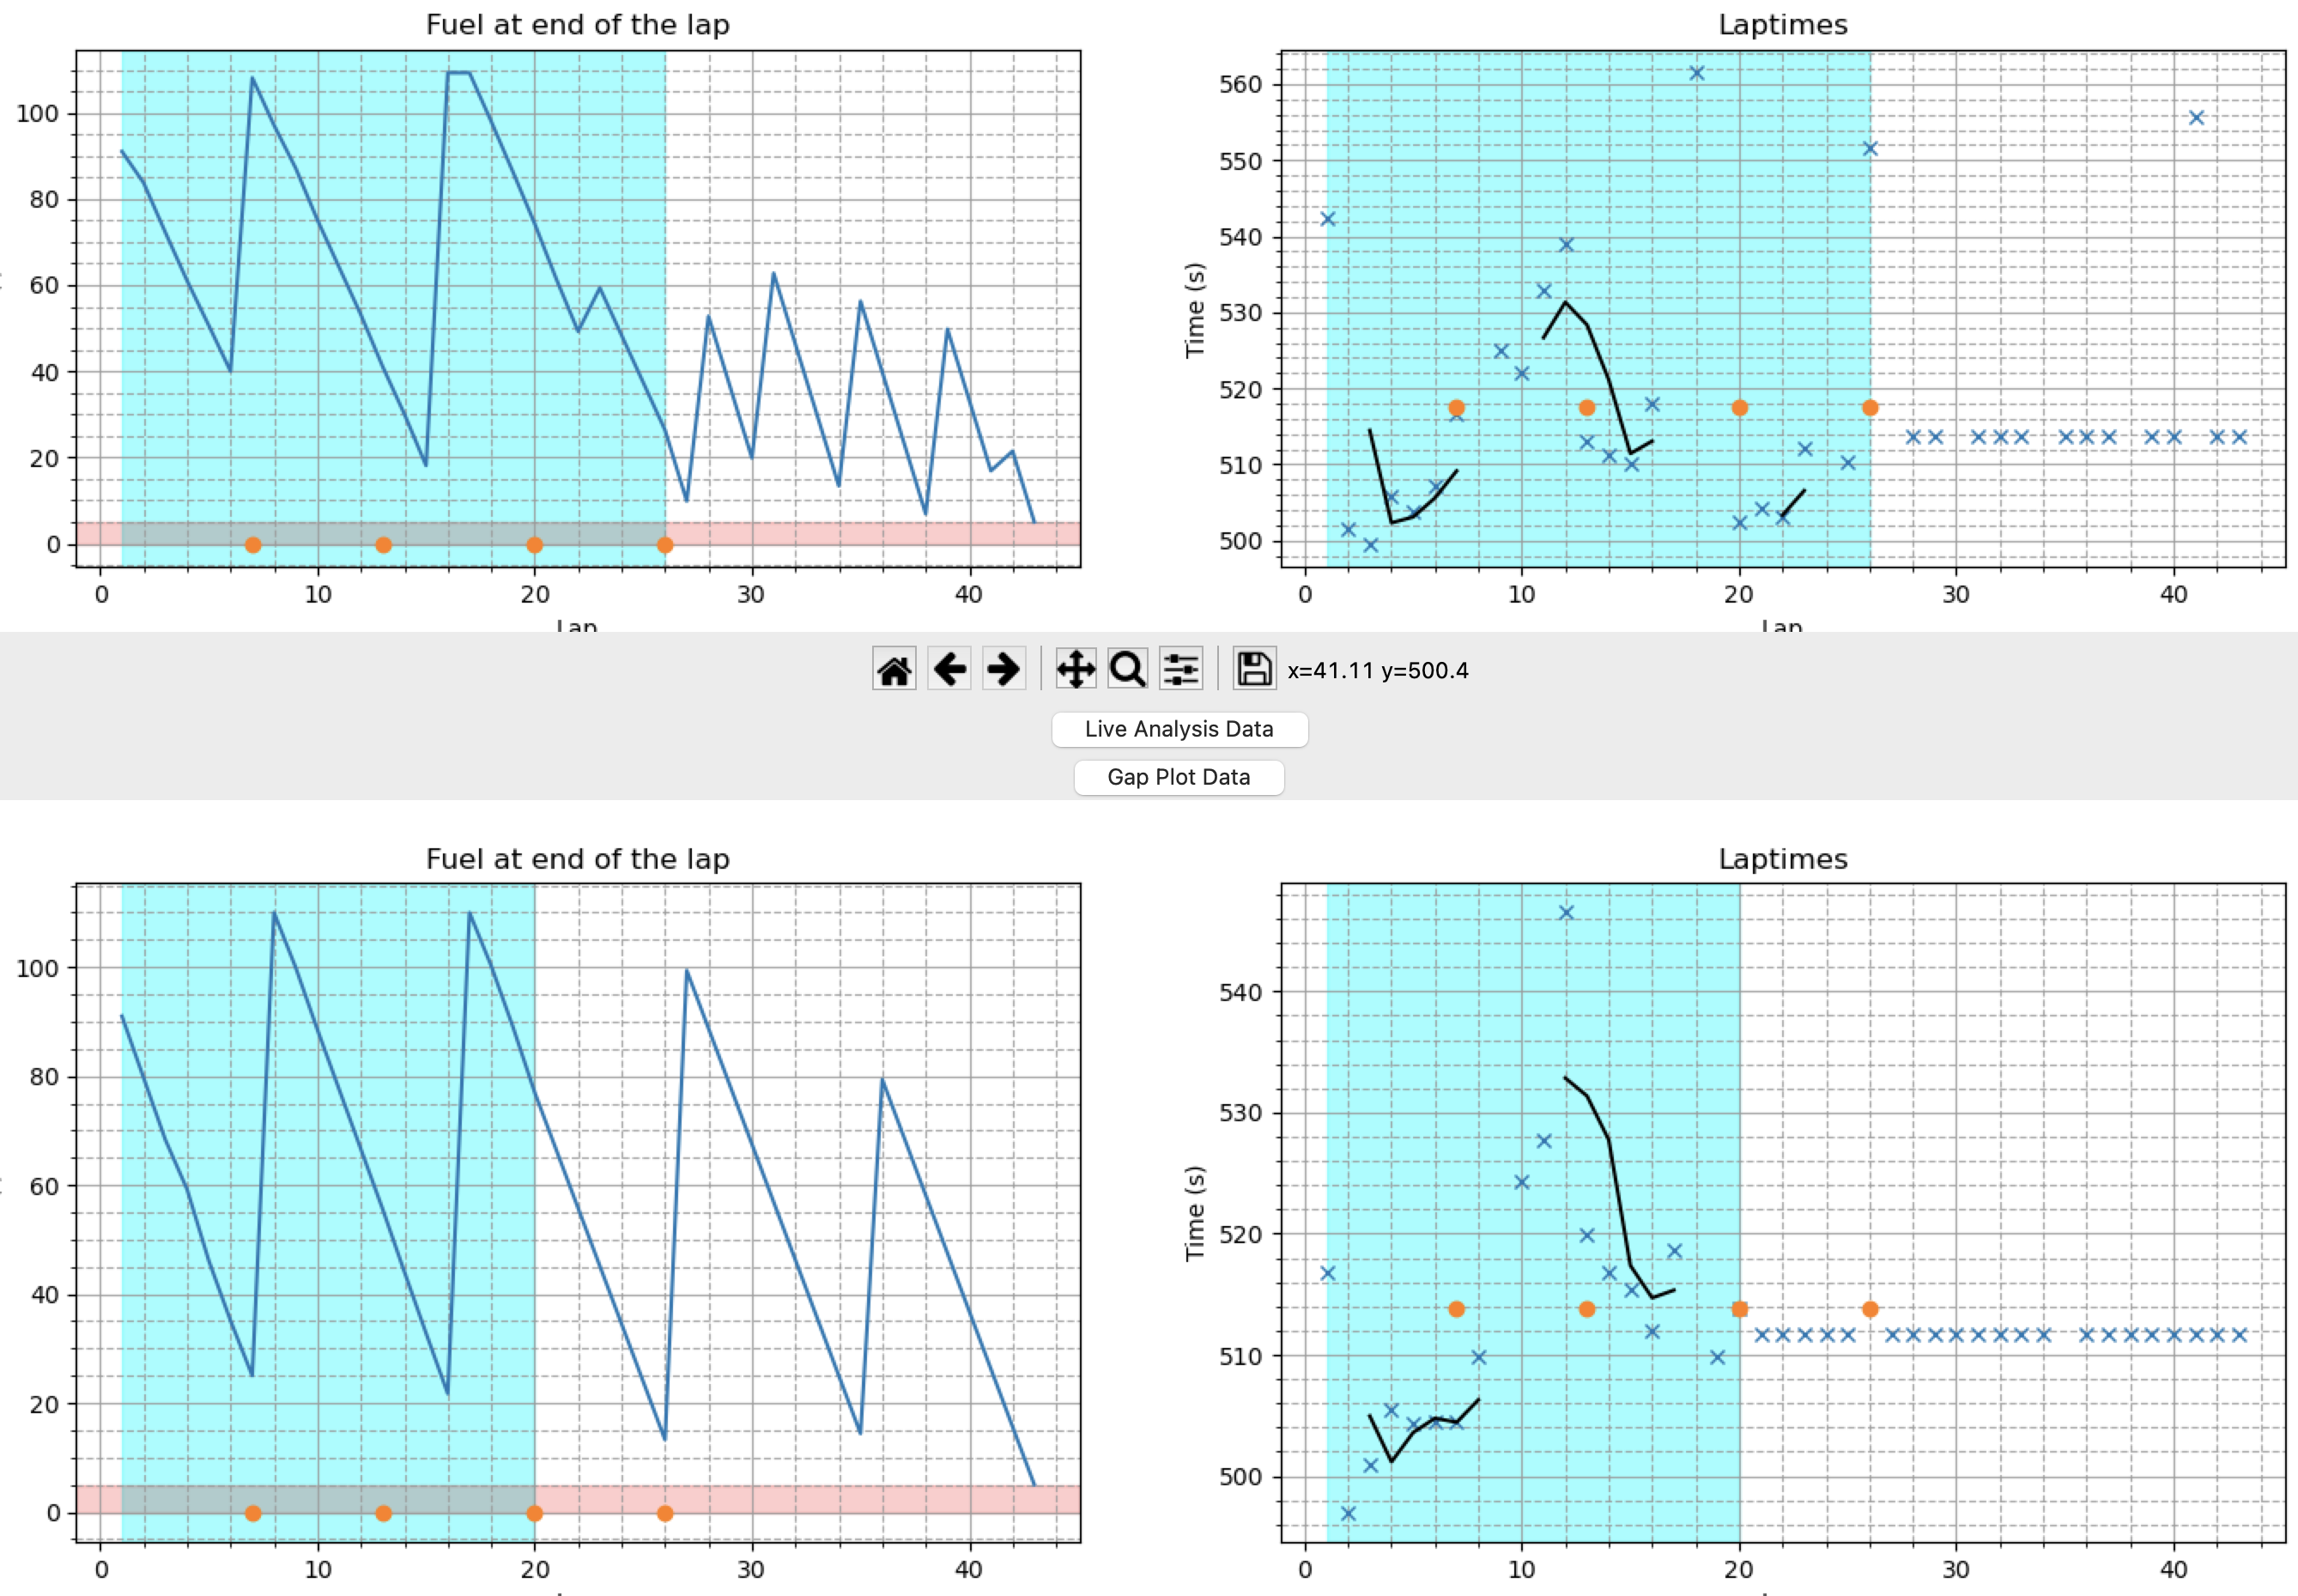
Above and below some plots to keep the overview I modified “real” data a bit.

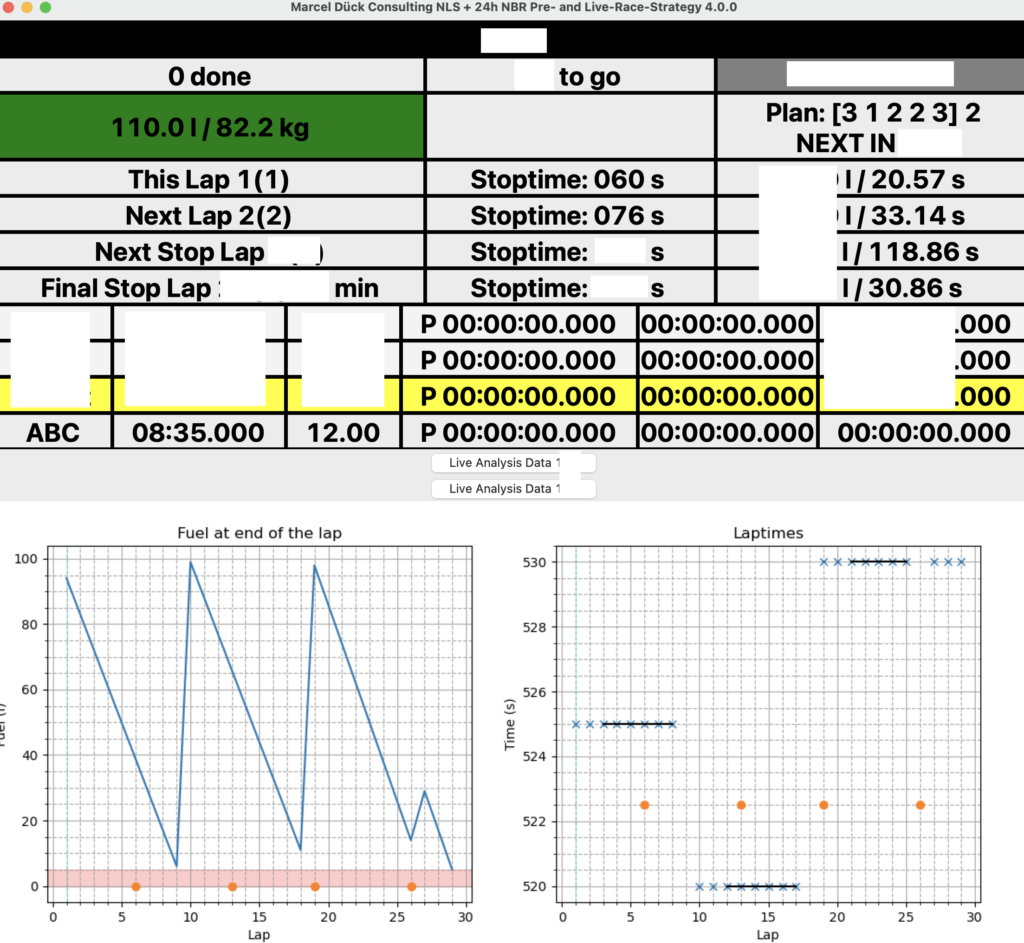
Now that we are going to manage three cars, I adjusted the software so that I have the information visualized per car. From a point of a software developer this is much better. I have now classes for pages and I can add just another page by writing a small class.
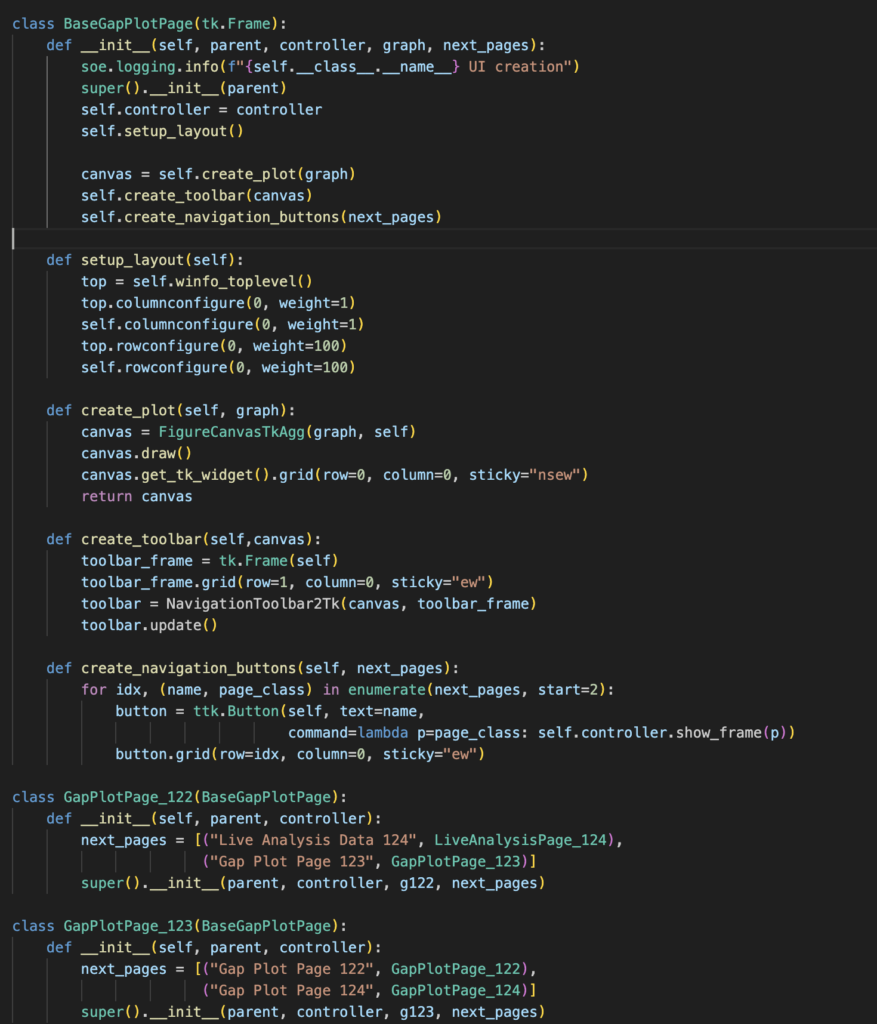
This is a smart solution and I can navigate through the pages. Just be sure, not all of my code looks that tidy! I hope there do not occur too many bugs since my last change. In fact there is nothing yet more stressful and challenging for me than doing some high speed bugfixing in my scrips, either excel or python, during a race lap. The Nürburgring is quite long, about 8 minutes, so there is plenty of time, but what about Dubai …


So with this you have a nice impression with how this all started and what I made out of it. When I talked to one of the GT3 Porsche strategy engineers from IMSA, he was right, learn excel and a programming language like python and you can bring some value to a race team. Another topic is scripts for post race analysis which I also created, there is a lot of data available after a race. So that’s about it for today. Next week I will hopefully get back to you with some good news directly from the track.
Thank you for reading my story from the motorsport world! Did you enjoy it?
Do you have a suggestion for the next topic? Or a question to this one? Leave a comment via my contact form: CLICK
You want to read another story? Checkout about my passion for motorsport photography and my engagement in the 24h of LeMans: LINK or about rules and regs in NLS: LINK
See you trackside!
Please note that the views, thoughts, and opinions expressed on this blog are solely my own and do not represent those of any of my affiliates, partners, or any entities I’m associated with. The content here is written from a personal perspective, aiming to share insights, experiences, and reflections that are mine alone. While I strive to provide accurate and up-to-date information, these writings reflect my personal viewpoints and interpretations at the time of publishing and should be read with that understanding in mind.
The information provided here is for general informational purposes only and is not intended to be a substitute for professional advice. Readers are encouraged to seek professional guidance for specific issues or concerns.
Thank you for reading and engaging with my content, keeping in mind the personal nature of this blog.